Community of Practice: Results are in...!
Final project outcome
You can also view the real posts on my instagram here: @leeshlovesyou
Development Process
Now that I knew how to visualise various forms of data in p5 (as documented in my previous post), I could begin presenting my questionnaire to my followers via Instagram. I came up with a series of questions:
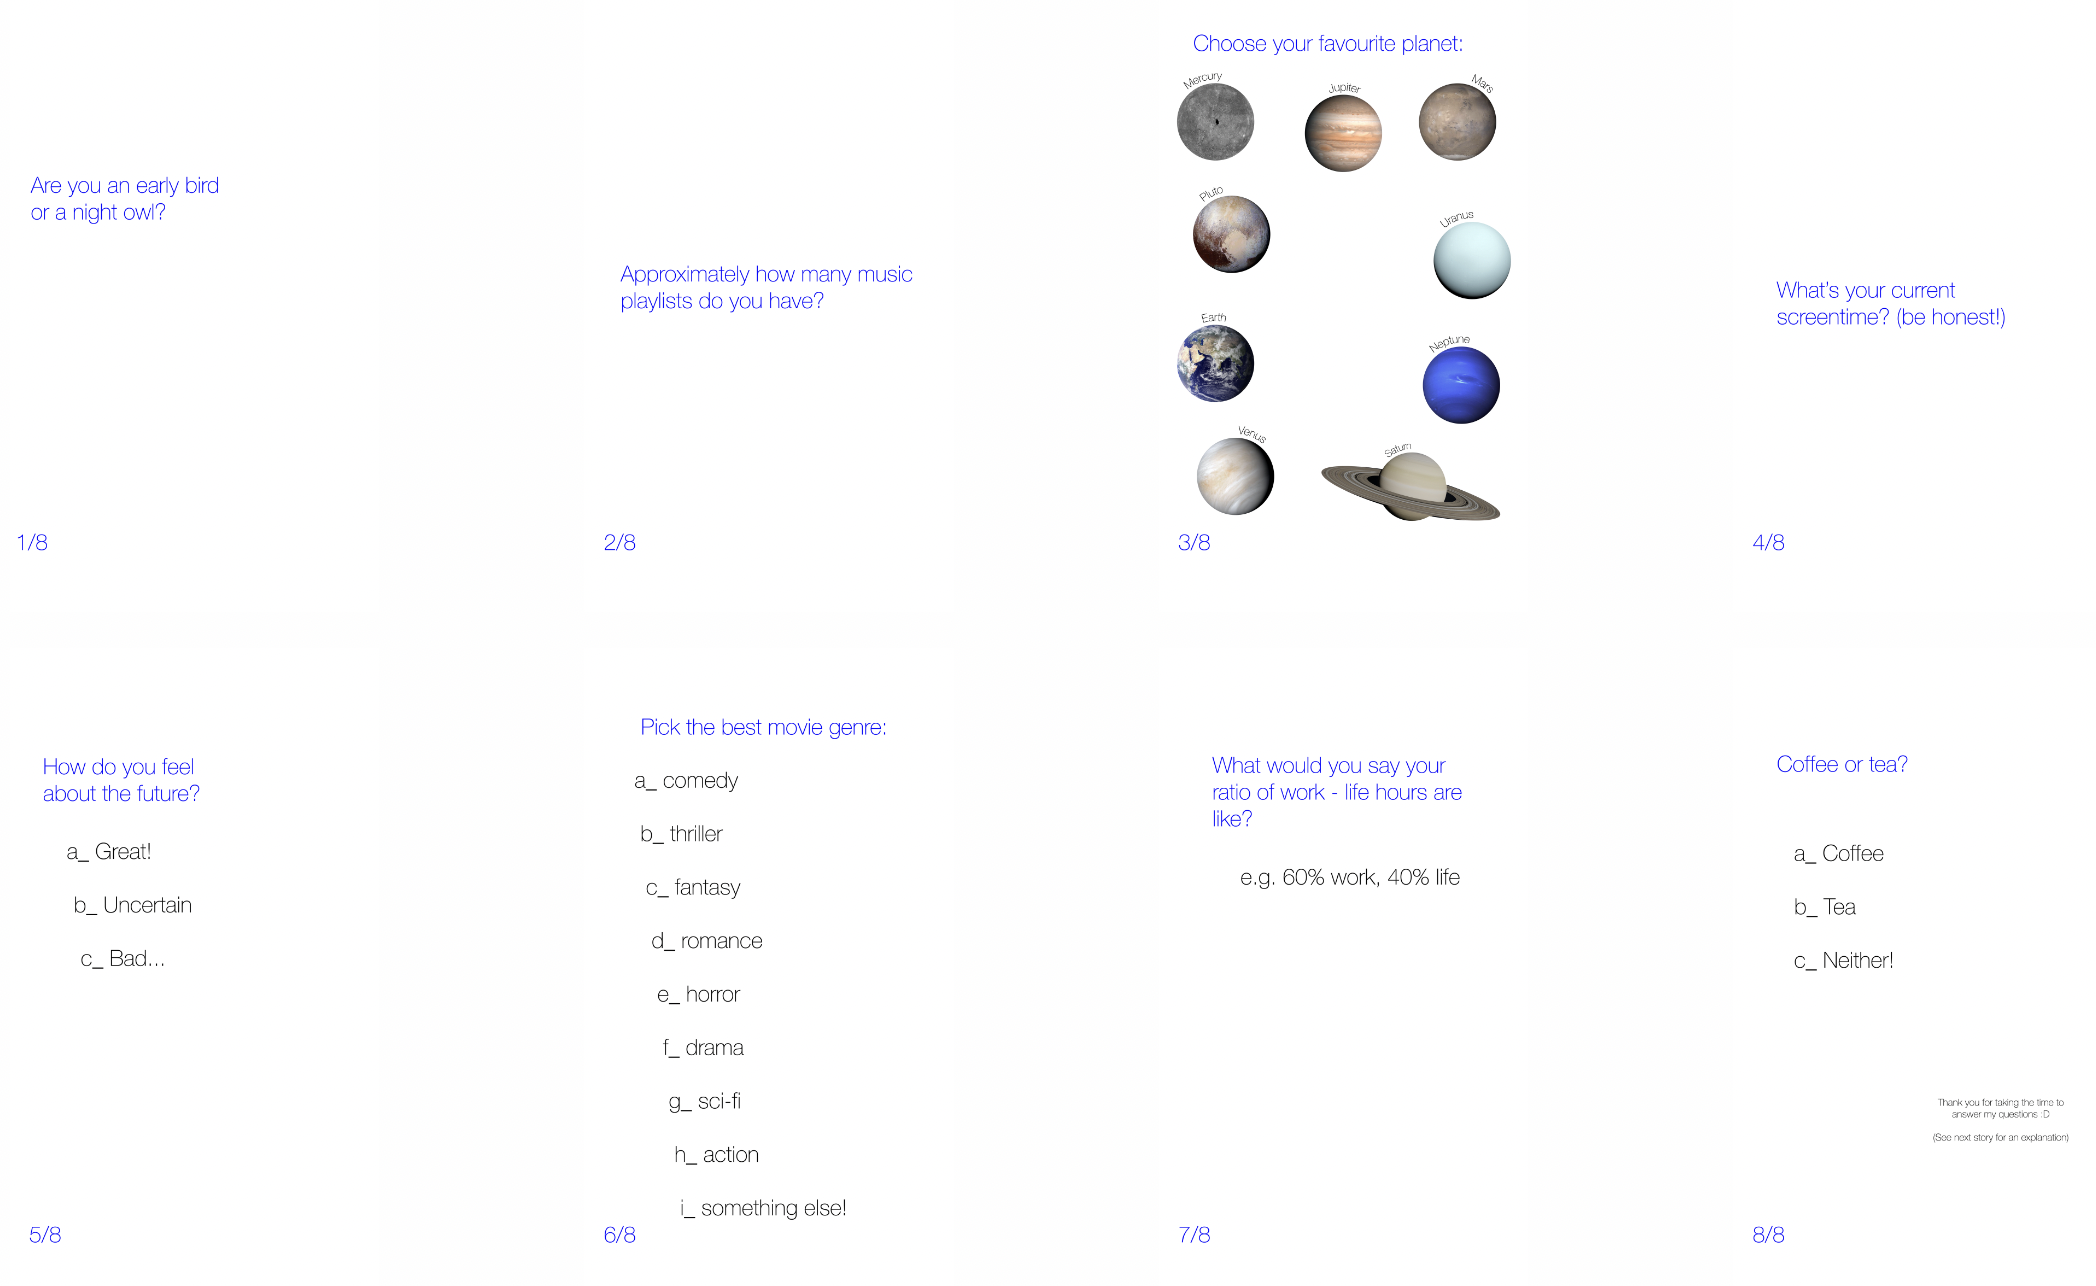
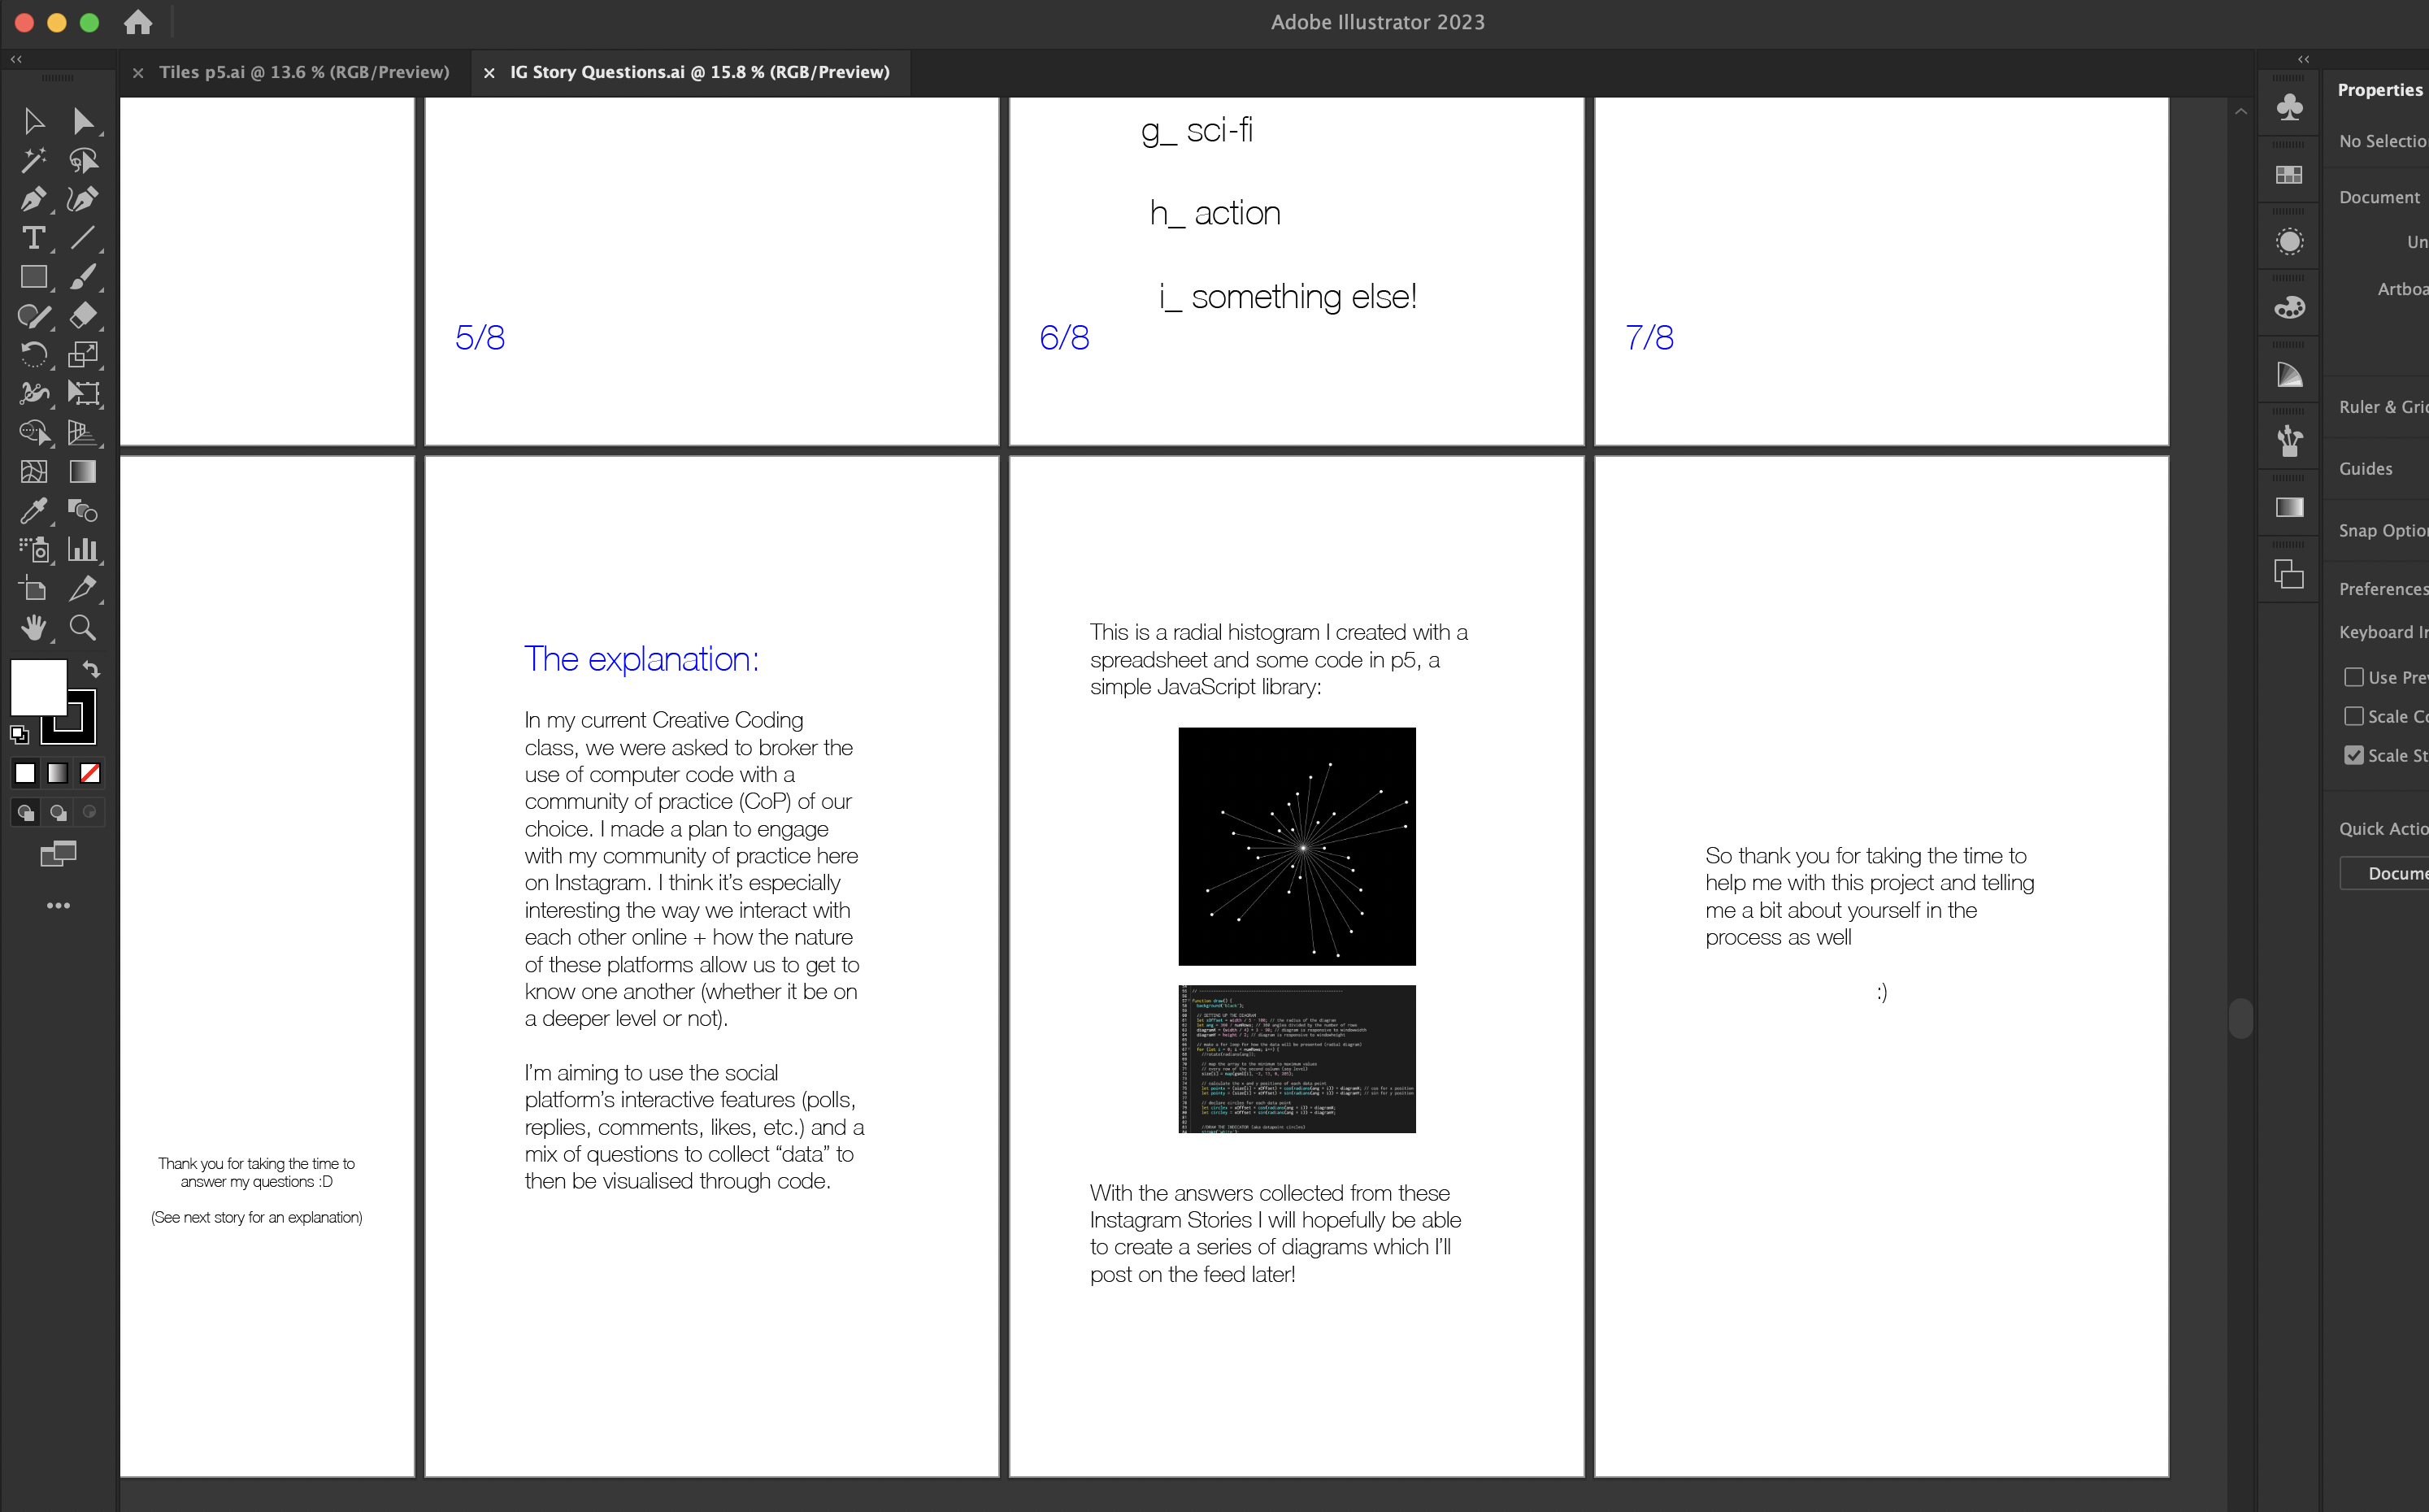
The start of the Story included an introduction at the start and an explanation at the end for those who wanted to know what they were participating in:
And after 24 hours, the results came in:
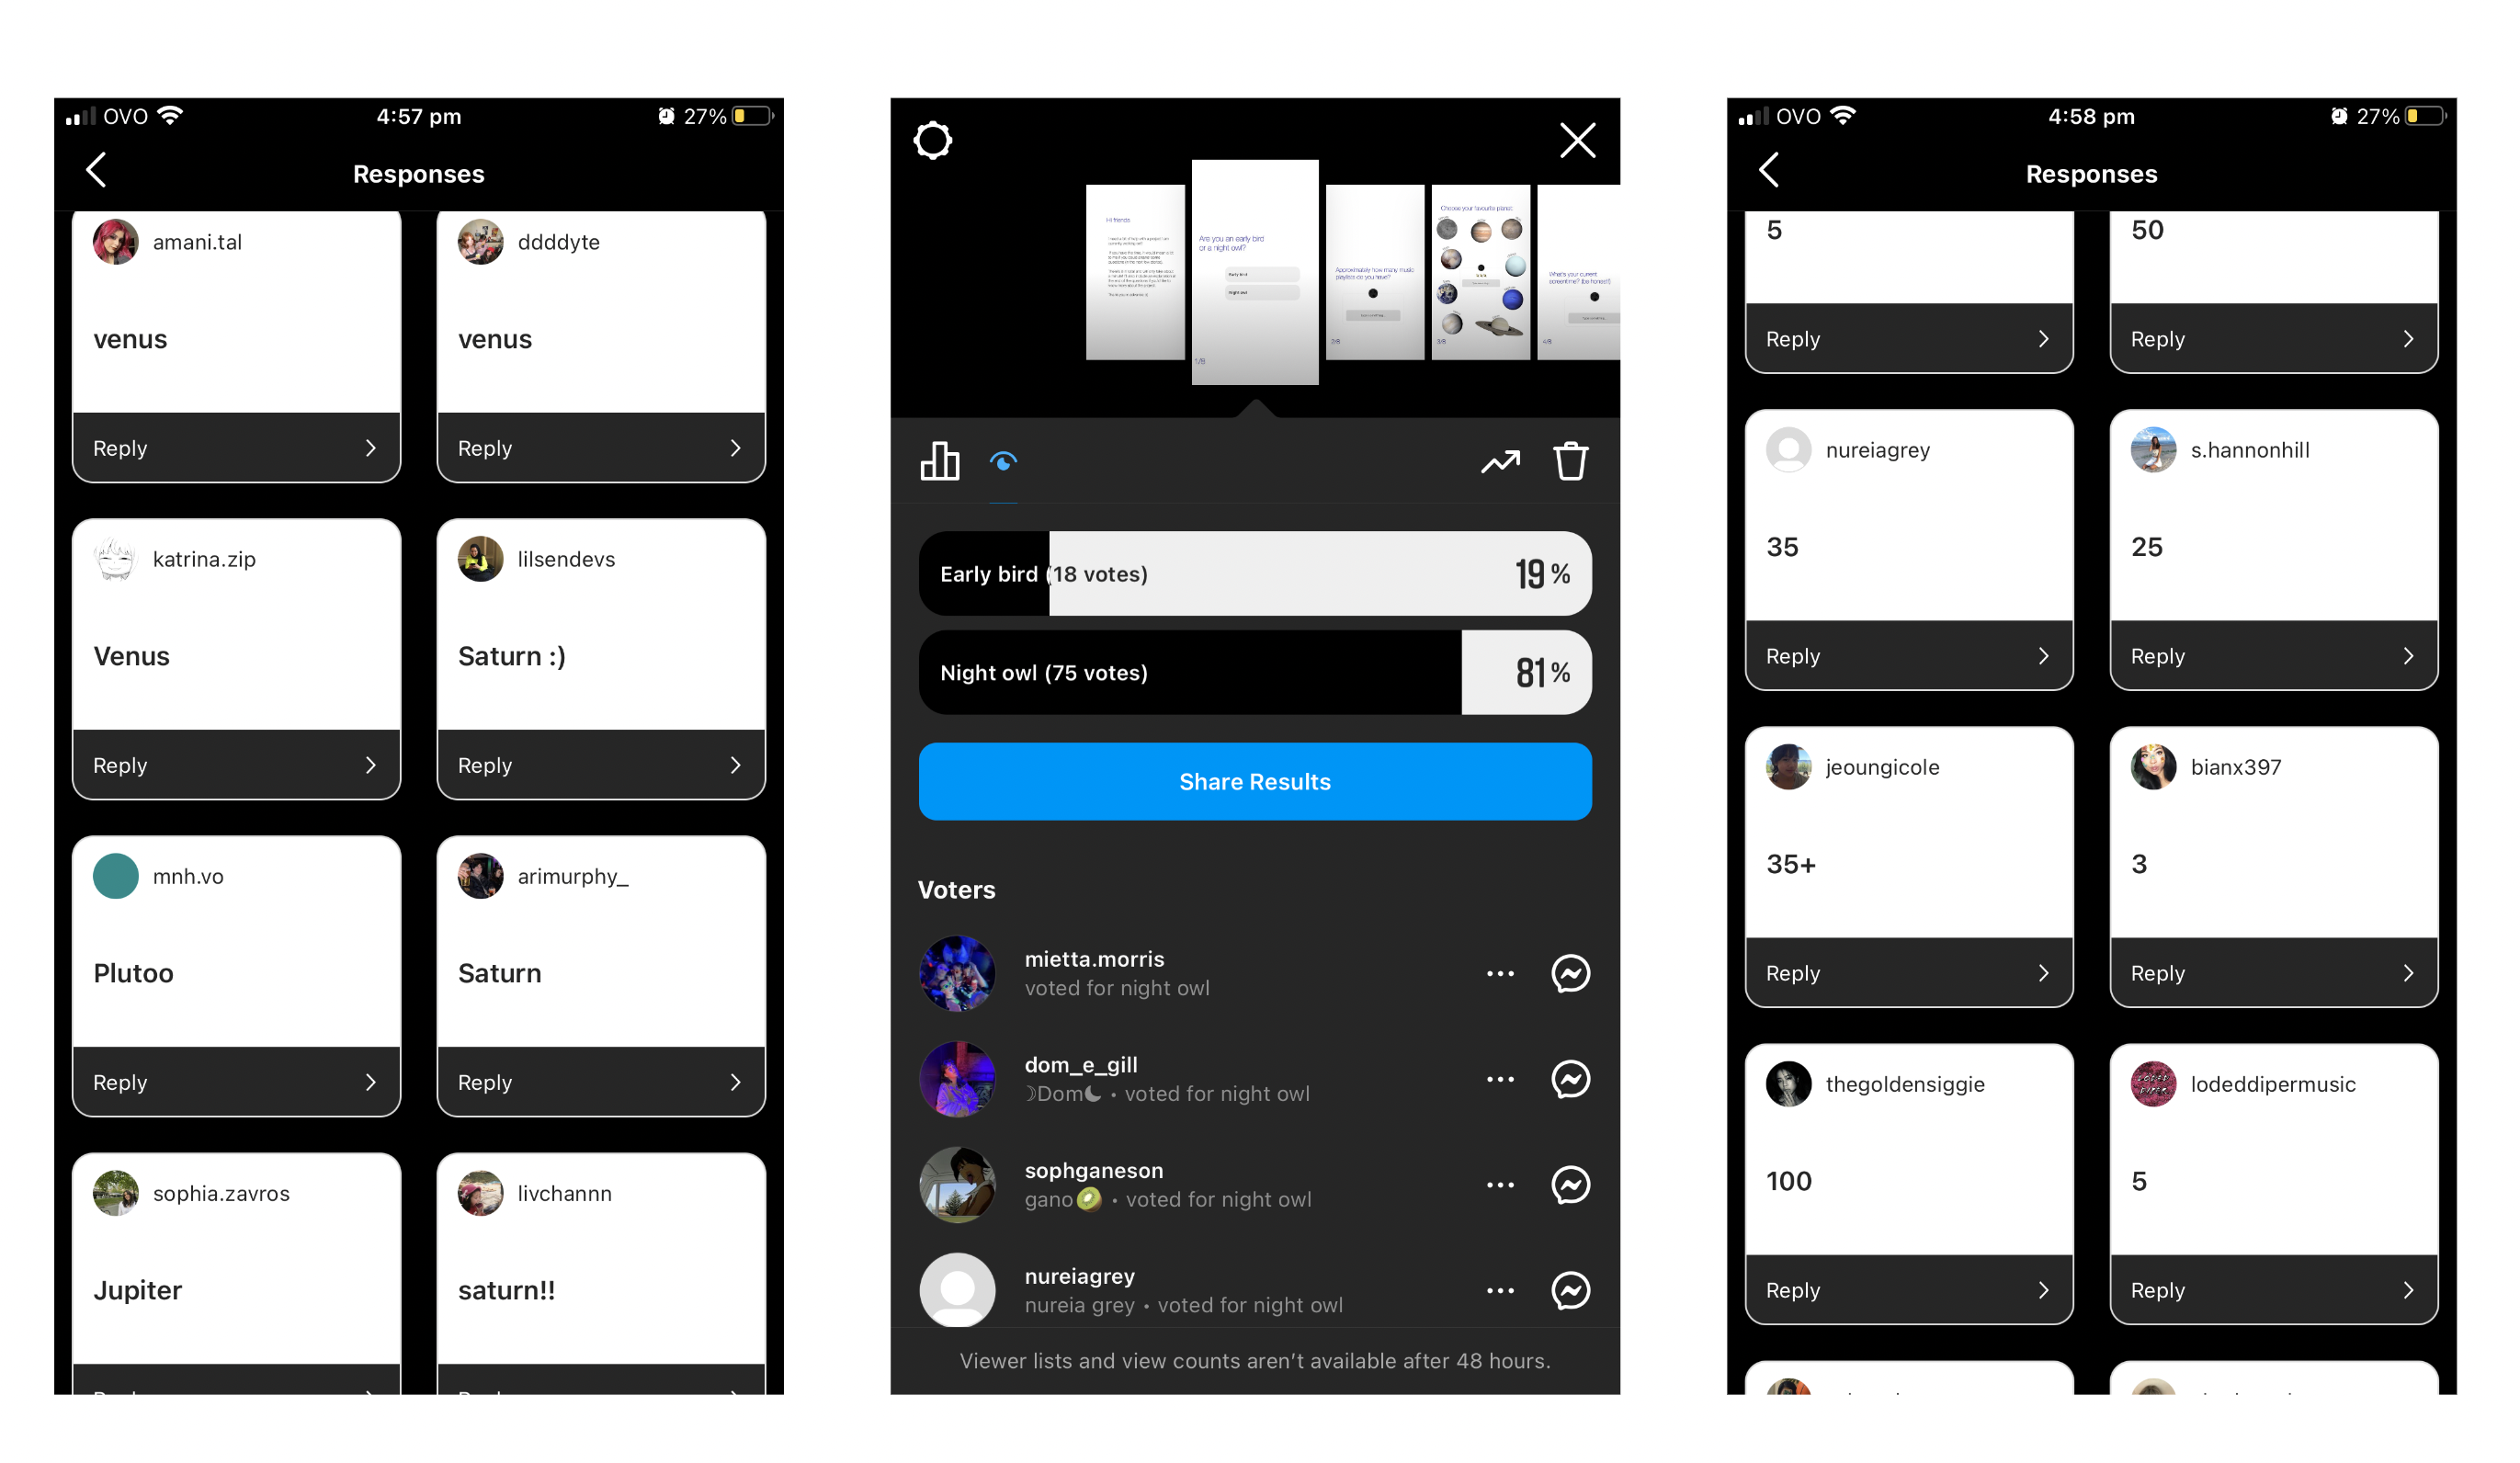
I had so much fun reading the answers that came through. Despite most of the questions being short-answer and straightforward, some answers were really quite personalised and made me feel closer to them in some ways. I truly learnt a lot about my followers, and to see what we had in common with each other. Some of the results surprised me as well- like most of my followers prefer tea to coffee?!
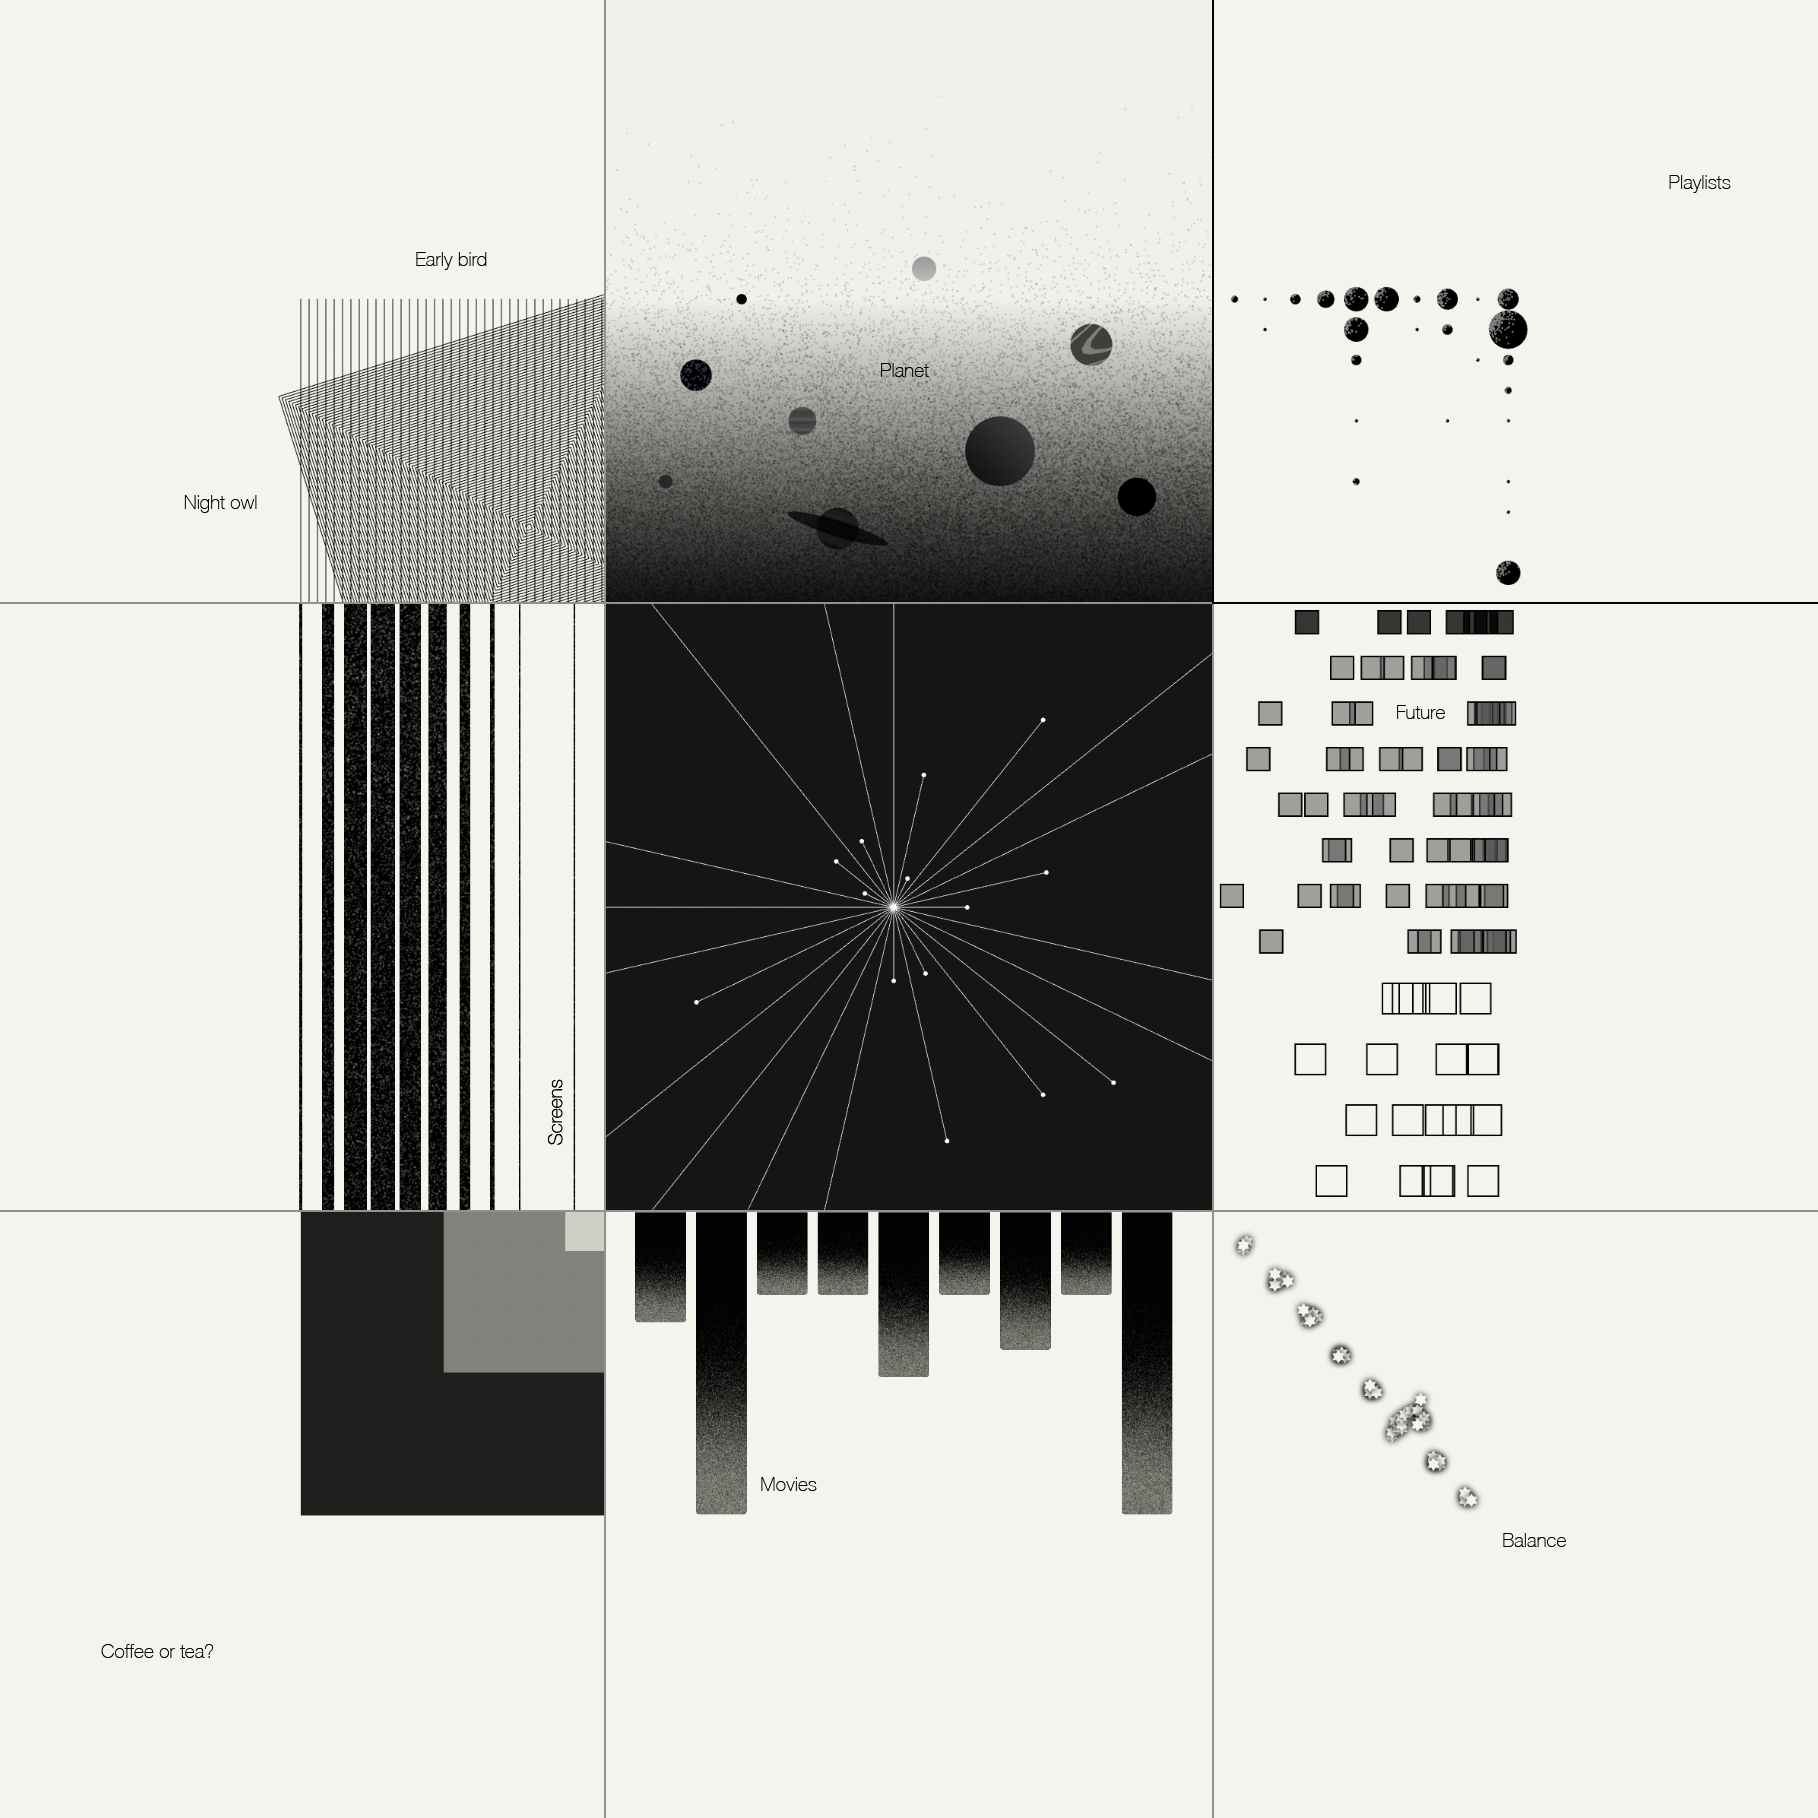
The Tiles
Taking these answers, I laid them out in csv files and set to work visualising the results in p5. Each question was represented in one 400 x 400px canvas, which, when posted in the feed, would connect to create one big picture in the grid. All of these ‘tiles’ would have a keyPressed() function which allows the user to save the canvas as an image when the Enter key is pressed, to be then easily posted.
I wanted to have fun with visualising these results, beyond the typical methods of creating bar charts and so forth. A lot of the patterns I created were quite simple, using techniques I had already learnt from previous assignments; but the more difficult part was representing the data in a way that could be easily understood by my followers whilst being stylistically appealing and minimalistic. It was a really enjoyable and important aspect of the project to allow myself to be creative with the data I had collected.
Here are the individual tiles:
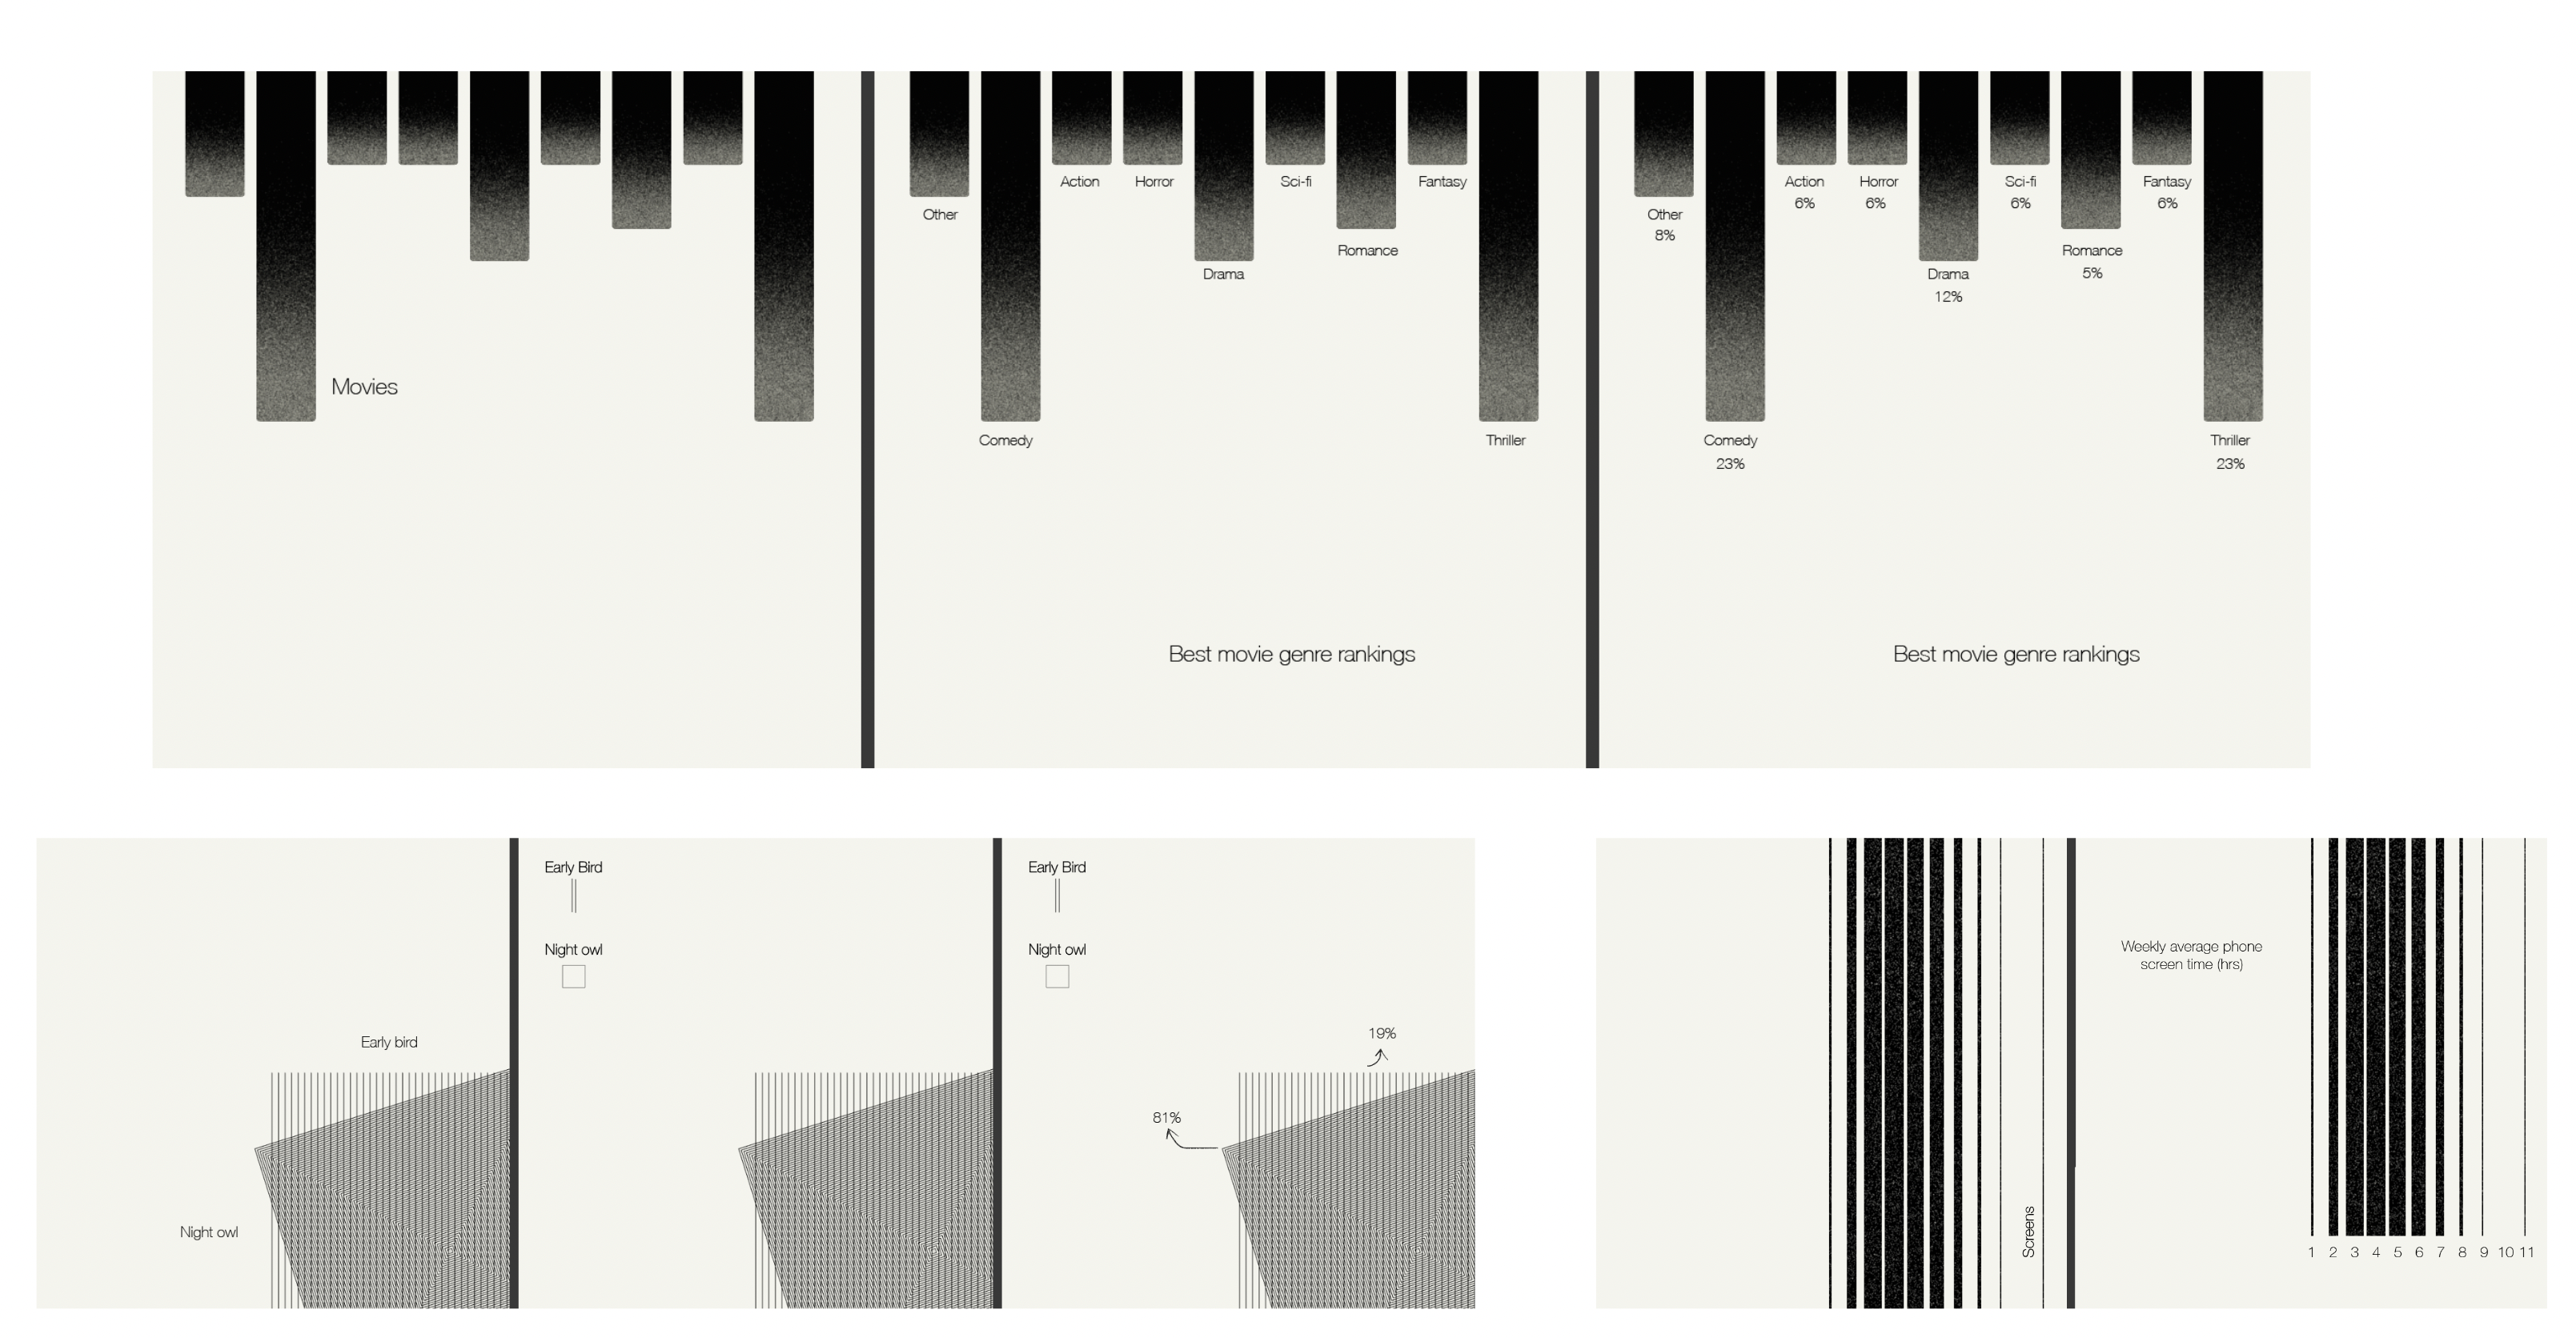
Early Bird or Night Owl?
Rotating moire-inspired pattern using for loops of lines and squares to represent two categories
Choose your favourite planet
Scattered ellipses with various patterns (from the Pattern.p5 library) to represent different planets. Planet sizes were also sized by substituting percentage values in the radius, then scaled accordingly. The background includes both a linear gradient and a noise pattern to create this fading galaxy look.
How many playlists do you own?
A table of circles made to scale with an array of values. A nosie pattern is used to achieve the animated grain texture effect.
What's your current phone screentime?
An array of values for each "stripe" represents the no. of hours of screentime per week- with, of course, a noise pattern.
Total Dataset
Radial histogram based off experiments from previous post. Data is taken from categories in a csv file, which show up when the mouse hovers over the data points.
How do you feel about the future?
Each square here actually represents a person, however, I randomised the x-position of each square to add visual interest. You can still see from the outset that the largest percentage are the gray squares (uncertain), with the opaque squares (certain) coming in second and the black squares (bad) last.
Coffee or Tea?
Very simple squares! But scaled accordingly to the percentage of votes. Tea (47%), coffee (40%), neither (13%)
What's the best movie genre?
Bar graph based off previous posts. And of course, more noise patterns!
Work-life Balance Ratio
Scatter chart created using a csv file. Substituted the plotted points for stars with a glow effect from last assignment.
Posting to the Grid
This is what the final results looked like all together:
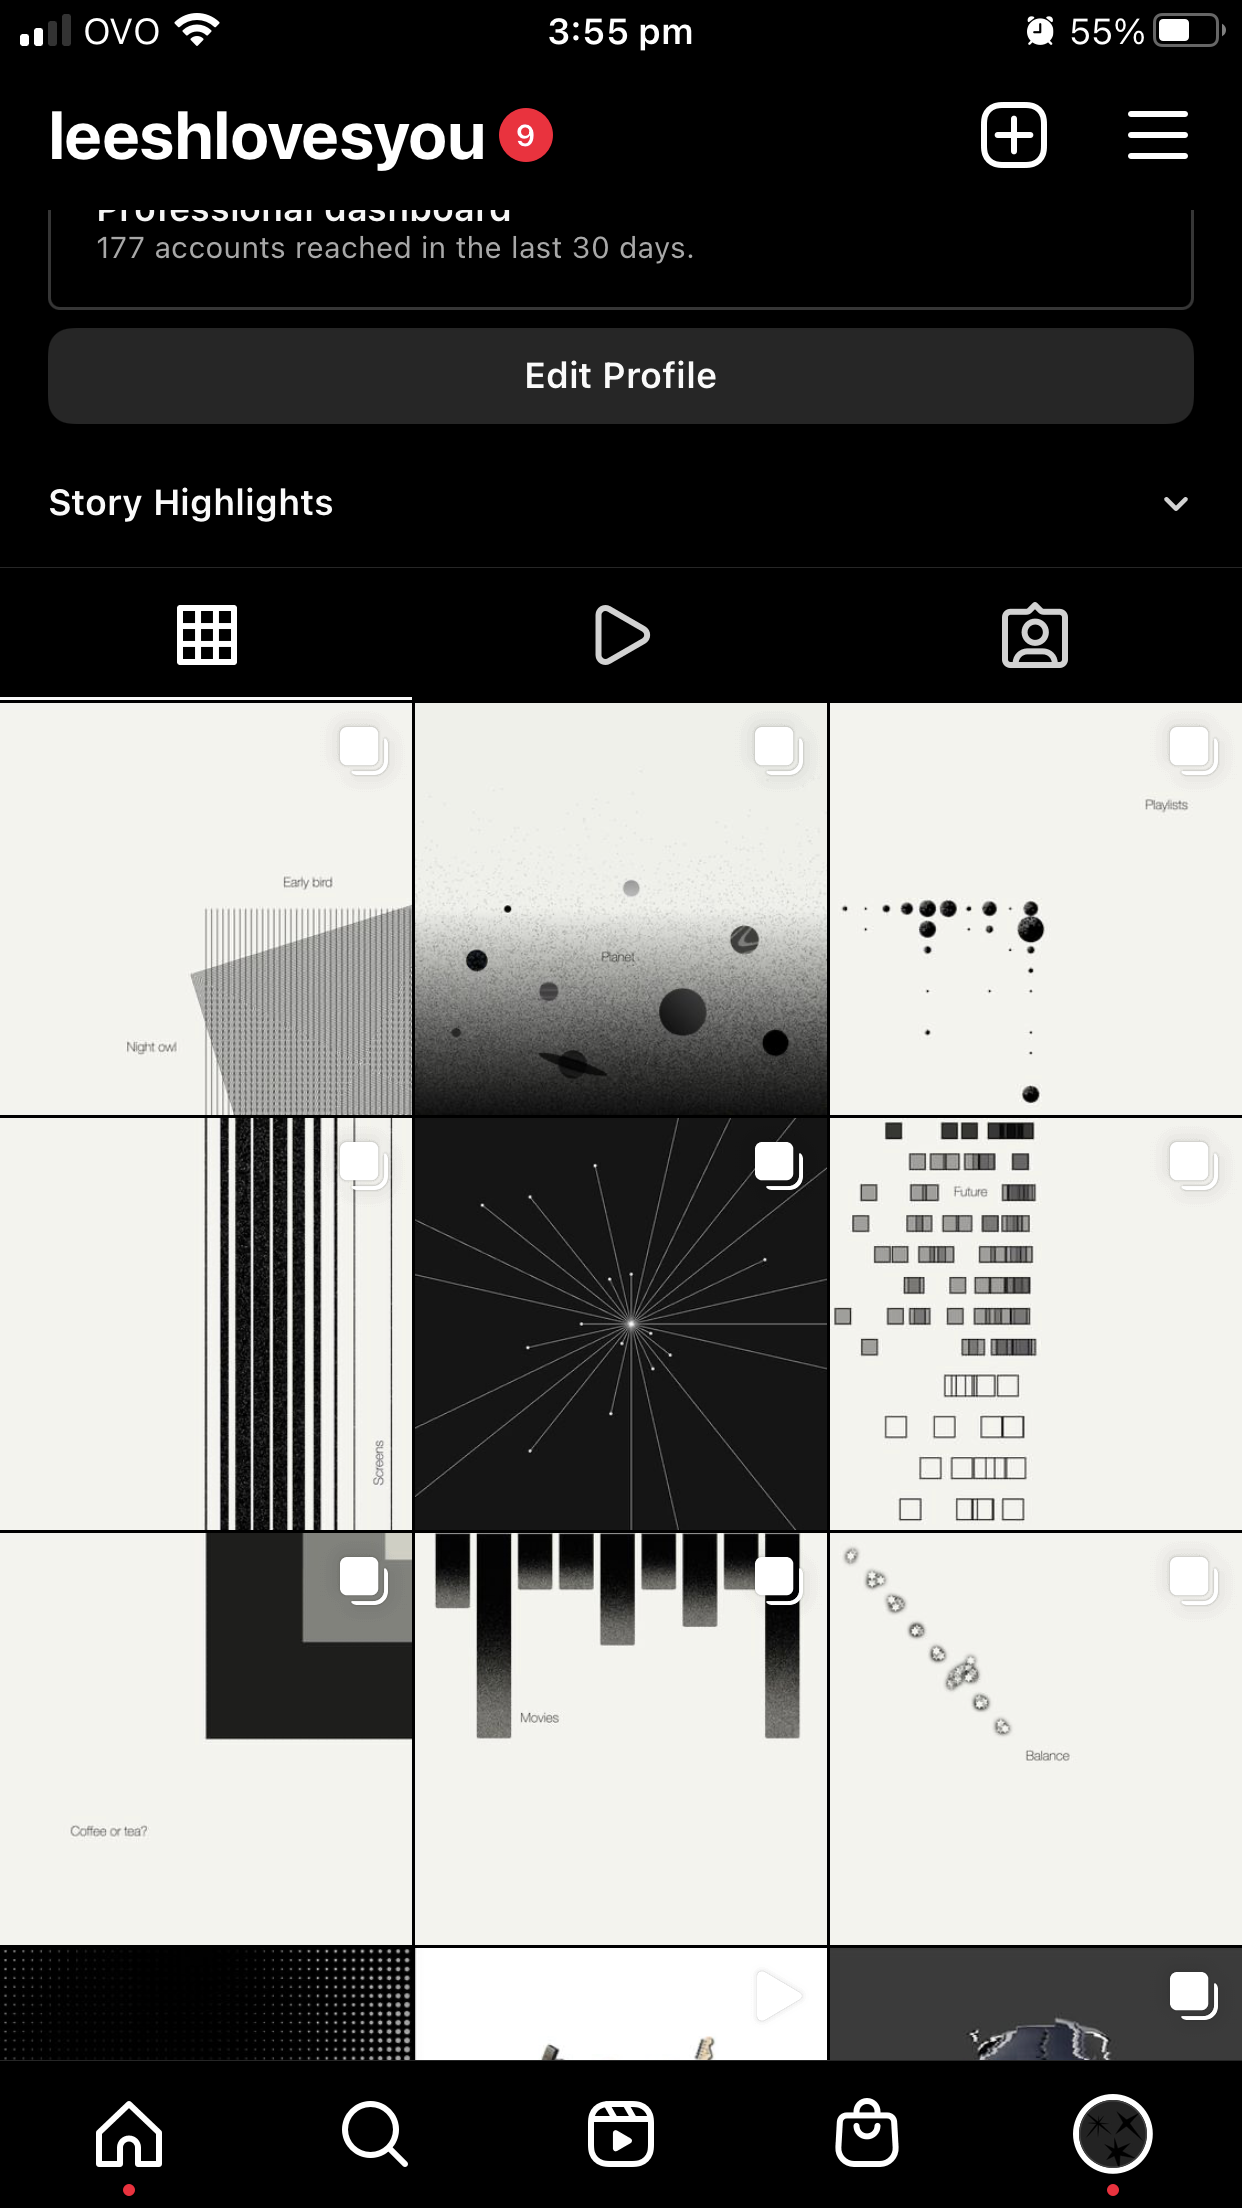
As you can see, each post is a carousel- this is because I included images with annotations of the results in the next slides, including keys and percentages, to demonstrate how the data should be read. If the tile had a coded animation or interactive feature, I would also include a video in the carousel as well.
And finally, here is the documentation (with more information about the domain and repertoire) of the process in a video format: